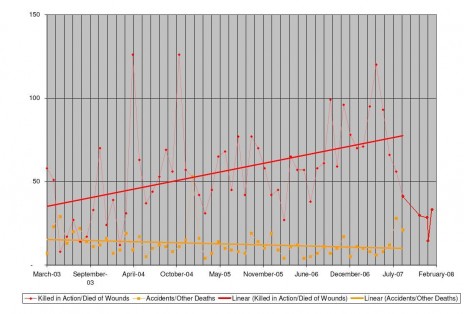
In February 2007, the United States increased the number of troops stationed within Iraq, in an attempt to improve security and reduce casualties. As of today, the number of troop casualties has, in general, gone down steadily, to some of the lowest points achieved during the war.
The issue that has been debated is whether the troop surge has lead to a meaningful decline in violence, indicative of effective US policy, or whether the troop surge is merely a statistically normal variation in Iraq casualties.
Although the analysis of the situation on the ground is an important part of determining whether the drop in casualties is meaningful, it is also useful to study this from a purely statistical standpoint. In the following paragraphs, I will use a variety of methods to answer the central question: has the troop surge caused a meaningful reduction in the number of US casualties in Iraq?
The Data:
http://siadapp.dmdc.osd.mil/personnel/
CA SUALTY/OIF-Total-by-month.pdf
The information from this graph will be used throughout this analysis. The graph at the bottom of this post will give you a rough idea of the data we're dealing with. (Creative Commons, with a few edits by me at the end to include more recent data points).
What is the variation from the mean?
The mean numbers of deaths/month = 53.98
The Standard Deviation = 27.02
Average Deaths after the troop surge began = 59.83
Number of standard deviations above the mean = .2
These results, if take alone, would show that the troop surge has had no statistically significant impact on troop casualties in Iraq. However, we have to consider the proposed model that the troop surge briefly increased casualties, but dramatically reduced them afterwards, due to the surge's success. If we take this model for granted, it seems to show that the later months of the surge have deviated significantly from the mean:
The mean numbers of deaths/month = 53.98
The Standard Deviation = 27.02
Surge Deaths per month as variance from mean, and z-score of variation:
February:
16.02
+.59
March:
17.02
+.63
April:
42
+1.56
May:
66
+2.45
June:
39
+1.45
July:
12
+0.44
August:
1
+0.04
September:
-12
-0.44
October:
-25
-0.93
November:
-26
-0.96
December:
-40
-1.48
January:
-20
-0.74
Under this model, there have been statistically significant variations from the mean during the later months. So, there does remain the possibility that the troop surge has had a statistically significant impact on troop casualties in the months following the beginning of the surge...
Although there is insufficient evidence to support the conclusion
Considering Rate of Change
One could argue that troop casualties were at a high at the start of the troop surge, and that the troop surge should be judged on its deviation from that point. Fair enough.
The Average change in casualty: -0.41
Standard Deviation of Rate of Change: 27
The Average change in casualty during the troop surge: -3.0
A z-test for significance finds that there was a significant reduction in casualty levels during the surge.
Conclusions
-We can conclude with 95% confidence that the US troop surge, beginning in 2007, significantly reduced the number of US casualties during that time frame.
-The number of casualties per month during the surge, however, was significantly above the mean casualty level throughout the Iraq war.
-For certain months later in the surge, there was a casualty level significantly lower than the war's overall mean.
-It's impossible to say if this is due to some regular periodic change, since there is no way to objectively determine the period of said change. Although it's obvious that there is some fluctuation from month to month, the graph obviously doesn't fit a single sine curve very well,
-So it really depends on your outlook. If we're looking at the change in casualty levels, than the surge has been a success, but if we look at the real number of casualties, it has pretty much been business as usual since casualty levels were so far above the mean at the start of the surge.
If any statisticians out there think they have a way of finding a periodic function that we can study the surge from, then by all means inform me. The calculator basically told me that there was no good sine curve, and my own work was only able to yield a sine curve with a regression of r = .3, which is pretty weak.
Also, if you're debating someone who uses weak reasoning to claim that the surge is an amazing success or an amazing failiure - without really understanding the fully issue, linking to this post might be an effective tactic.
Comments/Criticisms?

Imperator
This is probably one of the most useful, and thorough analyses on the NG bbs, and you've got ZERO comments?
I fucking hate Newgrounds.
But good work, if you've done your math right this puts the entire debate in proper perspectives. And as you said, it's really a matter of perspective.
Al6200
I've only taken one college level (community college) statistics class, so I'm by no means an expert, but I do think that the success or lack thereof of the troop surge is interesting.
I also think that the lack of comments/interest comes from the fact that I don't draw a conclusion one way or the other. I'm sure if my conclusion was "Troop surge is an amazing success!", then I'd be swimming with people looking to pwn me.